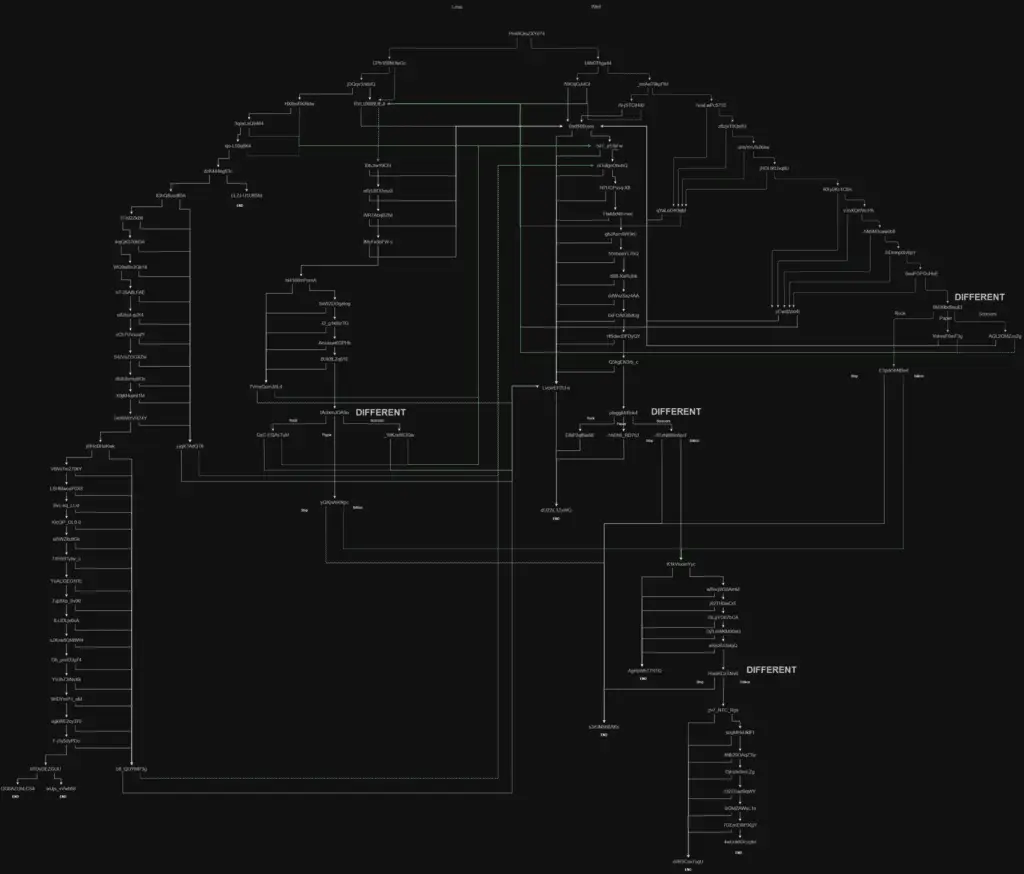
When I first saw CGP Grey’s Rock Paper Scissors video (embedded below), I immediately wanted to map out the whole tree and, using the YouTube API, see how the real proportion of viewers compared to the probabilities. Little did I know, it was about to consume my entire life for weeks.
I started mapping the whole tree in LucidChart but quickly ran out of shapes, so I migrated to Draw.io, an open-source alternative to finish the map.


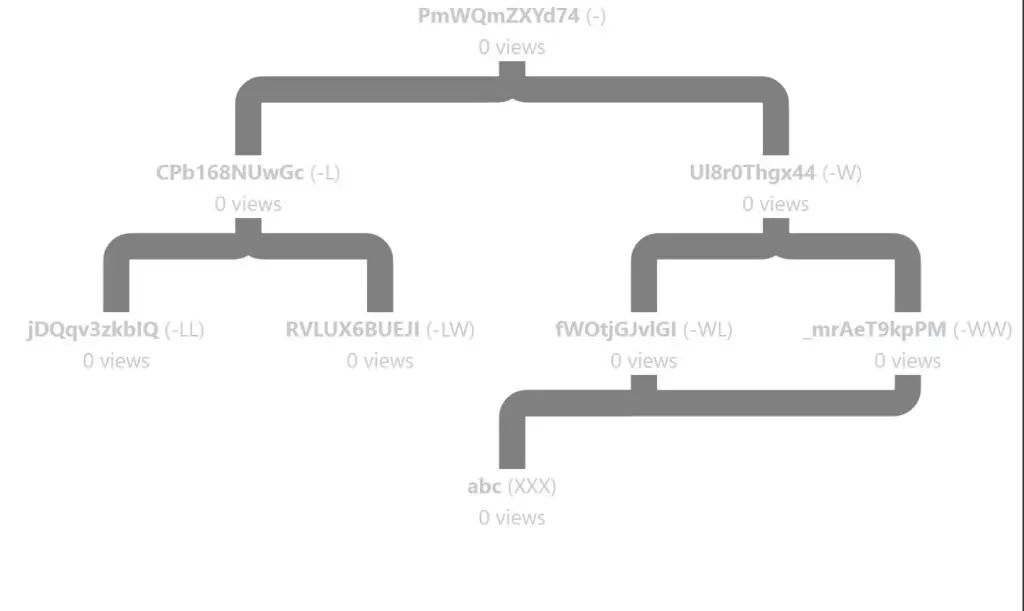
Now that the full map was done, it was time to start coding. I started with only the very top of the tree, trying to define a visual style for the project before moving on to the rest of the tree.
To keep track of all of the probabilities, I came up with my own notation for each path the player could take, which you can see below denoted by “-” for no decision, “W” for a win, “L” for a loss, and more decision types which come up later in the game.

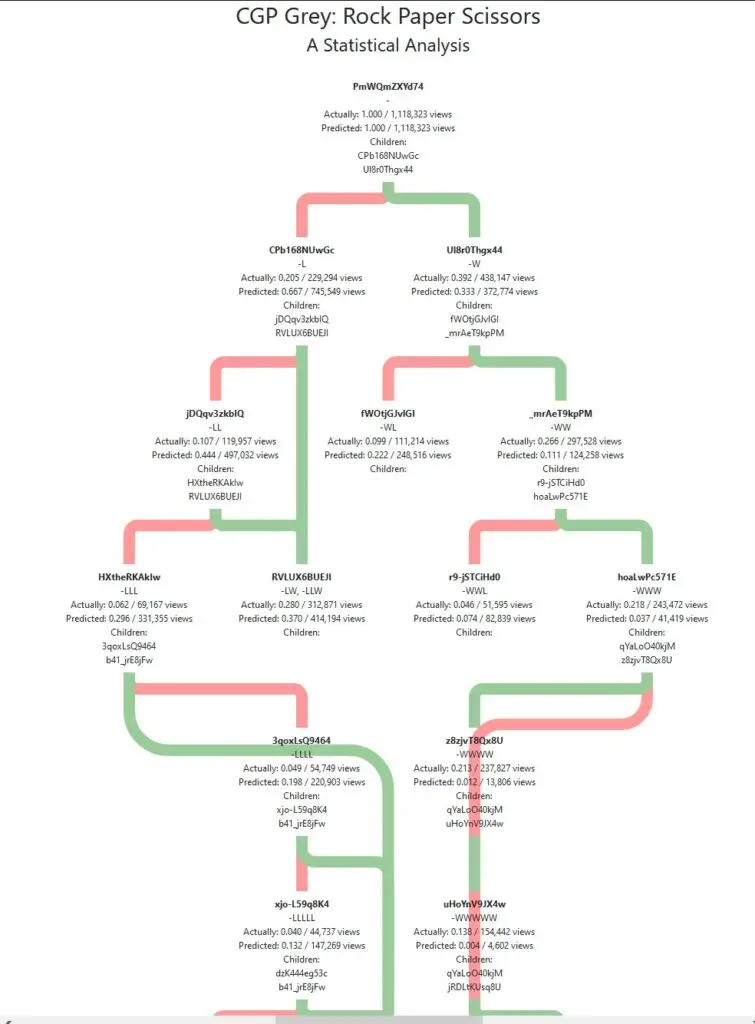
Having defined a visual style, I connected the YouTube API which allowed me to get the view count for every video.
To compare it to the statistically predicted value, I needed to figure out every single way players could get to every single video, and then sum the probabilities for each of those paths. You can see those in the following screenshot below each video ID.

From there, I added some toggles to show/hide the paths, children, and parents as they were getting quite overwhelming without being useful to most people.

FlwMxN9-mec. Maybe Too Much Info?…After adding some lose/win arrows to more easily navigate from video to video, the project was pretty much done!
There are several areas for improvements for which I’ve opened issues, especially the overlapping lines between blocks, but after coding for several days straight I needed a break. Maybe I’ll revisit this project in the future and give it a coat of polish.